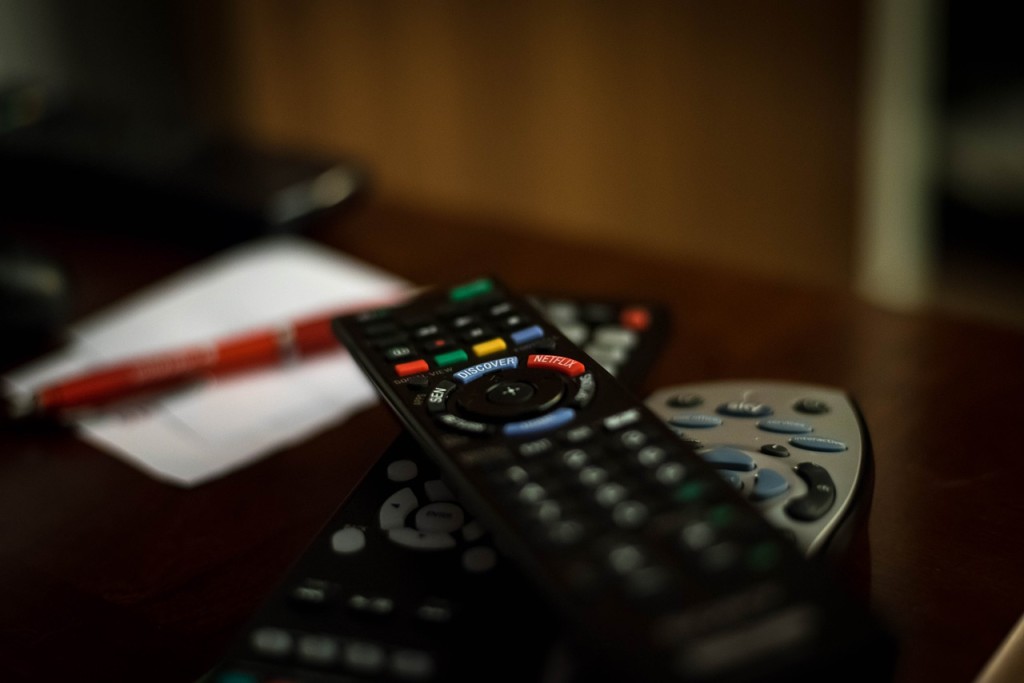
Consider this: With one 1 out of 3 millennials planning to cancel their cable TV subscription in 2016, the nation’s entertainment consumption patterns are undergoing a fundamental shift.
According to the results of the Reelgood Entertainment Habits Study — a national survey of 2,000 Americans conducted by the Reelgood smart watching app in conjunction with Learndipity Data Insights — viewers of streaming services like Netflix and Amazon Prime Video spend twice as long each day just searching for something to watch.
Notable findings of the study include:
1. AVERAGE TIME SPENT BROWSING BEFORE SELECTING A PROGRAM TO WATCH:
* Cable TV viewers: 9.1 minutes
* Netflix users: 17.8 minutes
2. AVERAGE NUMBER OF DAYS PER WEEK WATCHING ENTERTAINMENT PROGRAMMING:
* Cable TV viewers: 5.0 days per week
* Netflix users: 5.5 days per week
3. AVERAGE NUMBER OF PROGRAMS WATCHED PER DAY:
* Cable TV viewers: 4.1 programs per day
* Netflix users: 3.2 programs per day
Additionally, the Reelgood study revealed fascinating differences in how the attitudes of streaming programming users differ from traditional cable TV watchers:
5. TRUST IN ENTERTAINMENT RECOMMENDATIONS FROM FRIENDS
* Cable TV viewers: 19% value a friend’s recommendation more than a professional critic.
* Netflix users: 30% value a friend’s recommendation more than a professional critic.
6. DIFFERING ENTERTAINMENT TASTES FROM SPOUSE OR SIGNIFICANT OTHER
* Cable TV viewers: 30% want to watch something different than their spouse or significant other
* Netflix users: 40% want to watch something different than their spouse or significant other
7. STRONG IDENTIFICATION WITH SPECIFIC ENTERTAINMENT GENRE
* Cable TV viewers: 41% enjoy watching dramas and 56% enjoy watching comedies
* Netflix users: 63% enjoy watching dramas and 75% enjoy watching comedies
Reelgood is available for download on iTunes (and soon from Google Play):
